This website uses cookies so that we can provide you with the best user experience possible. Cookie information is stored in your browser and performs functions such as recognising you when you return to our website and helping our team to understand which sections of the website you find most interesting and useful.


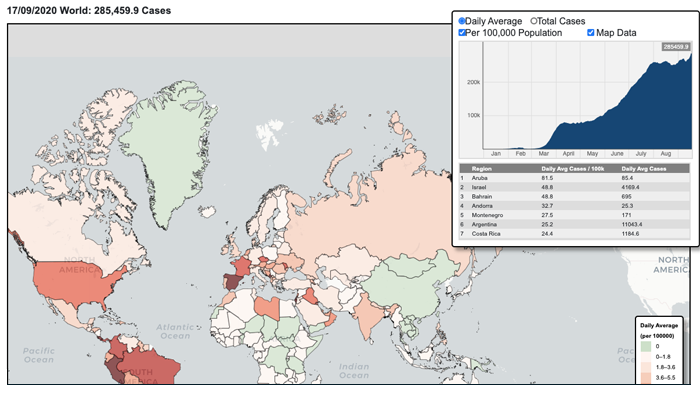
We are delighted to introduce our interactive Oxford University COVID-19 Tracker (OxCOVID-19 Tracker). The Tracker provides a clear way to view the geographic spread of the global pandemic as well as a more detailed view of the UK. See how your local situation compares to that of neighboring areas and how different parts of the world are experiencing the pandemic.
You can choose to view the cumulative impact by selecting the total number of cases to date or to see the current state of the epidemic by selecting the average daily numbers over the last seven days. By keeping the ‘per 100,000 population’ box checked, see the rate of cases adjusted for the population of the local authority or country.
Click on an area to see a graph of how COVID-19 has developed over time in that location or use the slider at the top to see a snapshot of the pandemic at any time in the past.
The Tracker draws on epidemiology and administrative data from University of Oxford OxCOVID19 Database.
