OxCOVID19 Database is a large, single-centre, multimodal relational database consisting of information related to COVID-19 pandemic.
About
If you find OxCOVID19 Database useful please cite+:
Adam Mahdi, Piotr Błaszczyk, Paweł Dłotko, Dario Salvi, Tak-Shing Chan, John Harvey, Davide Gurnari, Yue Wu, Ahmad Farhat, Niklas Hellmer, Alexander Zarebski, Bernie Hogan, Lionel Tarassenko, Oxford COVID-19 Database: a multimodal data repository for better understanding the global impact of COVID-19. University of Oxford, 2020. medRxiv (doi: https://doi.org/10.1101/2020.08.18.20177147).
The OxCOVID19 Database is currently comprised of six tables:
- EPIDEMIOLOGY
- GOVERNMENT_RESPONSE
- COUNTRY_STATISTICS
- MOBILITY
- WEATHER
- ADMINISTRATIVE_DIVISION
The OxCOVID19 Database is the result of many hours of volunteer efforts and generous contributions of many organisations. If you use a specific table please also cite the underlying source (see Sources).
Accessing the OxCOVID19 Database
- PostgreSQL database, provides direct access to the database.
- GitHub CSV files, CSV files updated regularly are available on GitHub.
- OxCOVID19 R package provides an interface, oxcovid19, developed by Ernest Guevarra, Chris Mercado and Robert Medina, members of the CoMo Consortium.
- FigShare snapshot, an archived version of the database as of September 2020.
Note that the whole database is available via the PostgreSQL database with only a subset available as CSV files on GitHub and in the FigShare snapshot.
Disclaimer
Some regions have undergone name changes since the last release of the GADM database. In our database we follow exactly the GID and names as given in GADM. This is merely to guarantee a standard way of relating data. In no case is this choice a manifestation of any political views by us or our universities.
Data Structures
There are currently six Tables in Oxford Covid-19 (OxCOVID19) Database with the data structures (Schemas) shown below.
Note 1: We collect the data as they come from the indicated data sources. It is possible that different sources provide different statistics.
Note 2: The data structure might change in the future as more data becomes available or data sources change. We will do our best to maintain backward compatibility.
Schema for EPIDEMIOLOGY table
| Name | Data type | Description |
|---|---|---|
| SOURCE | VARCHAR | Data source |
| DATE | DATE | Day of the statistics |
| GID | ARRAY | Unique geographical ID, for more details see GADM |
| COUNTRY | VARCHAR | English name for the country |
| COUNTRYCODE | VARCHAR(3) | ISO 3166-1 alpha-3 country codes |
| ADM_AREA_1 | VARCHAR | First-level administrative country subdivision |
| ADM_AREA_2 | VARCHAR | Second-level administrative country subdivision |
| ADM_AREA_3 | VARCHAR | Third-level administrative country subdivision |
| TESTED | INT | Number of people tested [cumulative] |
| CONFIRMED | INT | Number of confirmed cases [cumulative] |
| DEAD | INT | Number of deaths [cumulative] |
| RECOVERED | INT | Number of confirmed who recovered [cumulative] |
| HOSPITALISED | INT | Number of confirmed who are/have been hospitalised [cumulative] |
| HOSPITALISED_ICU | INT | Number of confirmed who are/have been in the intensive care [cumulative] |
| QUARANTINED | INT | Number of confirmed with home quarantine [cumulative] |
Schema for GOVERNMENT_RESPONSE table
The government response data comes from the Coronavirus Government Response Tracker assembled by researchers from the Blavatnik School of Government, University of Oxford. The data are being collected from publicly available sources including news articles and government press releases and briefings.
| Name | Data type | Description |
|---|---|---|
| SOURCE | VARCHAR | Data source |
| DATE | DATE | Day of the statistics |
| GID | ARRAY | Unique geographical ID, for more details see GADM |
| COUNTRY | VARCHAR | English name for the country |
| COUNTRYCODE | VARCHAR(3) | ISO 3166-1 alpha-3 country codes |
| ADM_AREA_1 | VARCHAR | First-level administrative country subdivision |
| ADM_AREA_2 | VARCHAR | Second-level administrative country subdivision |
| ADM_AREA_3 | VARCHAR | Third-level administrative country subdivision |
| ADM_AREA_3 | VARCHAR | Third-level administrative country subdivision |
| C1_SCHOOL_CLOSING | INT | Record closings of schools and universities |
| C1_FLAG | INT | Binary flag for geographic scope |
| C2_WORKPLACE_CLOSING | INT | Record closings of workplaces |
| C2_FLAG | INT | Binary flag for geographic scope |
| C3_CANCEL_PUBLIC_EVENTS | INT | Record cancelling public events |
| C3_FLAG | INT | Binary flag for geographic scope |
| C4_RESTRICTIONS_ON_GATHERINGS | INT | Record limits on private gatherings |
| C4_FLAG | INT | Binary flag for geographic scope |
| C5_CLOSE_PUBLIC_TRANSPORT | INT | Record closing of public transport |
| C5_FLAG | INT | Binary flag for geographic scope |
| C6_STAY_AT_HOME_REQUIREMENTS | INT | Record orders to “shelter-in-place” and otherwise confine to the home |
| C6_FLAG | INT | Binary flag for geographic scope |
| C7_RESTRICTIONS_ON_INTERNAL_MOVEMENT | INT | Record restrictions on internal movement between cities/regions |
| C7_FLAG | INT | Binary flag for geographic scope |
| C8_INTERNATIONAL_TRAVEL_CONTROLS | INT | Record restrictions on international travel. Note: this records policy for foreign travellers, not citizens |
| E1_INCOME_SUPPORT | INT | Record if the government is providing direct cash payments to people who lose their jobs or cannot work. Note: only includes payments to firms if explicitly linked to payroll/salaries |
| E1_FLAG | INT | Binary flag for geographic scope |
| E2_DEBTCONTRACT_RELIEF | INT | Record if the government is freezing financial obligations for households (eg stopping loan repayments, preventing services like water from stopping, or banning evictions) |
| E3_FISCAL_MEASURES | FLOAT | Announced economic stimulus spending. Note: only record amount additional to previously announced spendings |
| E4_INTERNATIONAL_SUPPORT | FLOAT | Announced offers of Covid-19 related aid spending to other countries. Note: only record amount additional to previously announced spending |
| H1_PUBLIC_INFORMATION_CAMPAIGNS | INT | Record presence of public info campaigns |
| H1_FLAG | INT | Binary flag for geographic scope |
| H2_TESTING_POLICY | INT | Record government policy on who has access to testing. Note: this records policies about testing for current infection (PCR tests) not testing for immunity (antibody test) |
| H3_CONTACT_TRACING | INT | Record government policy on contact tracing after a positive diagnosis |
| H4_EMERGENCY_INVESTMENT_IN_HEALTHCARE | FLOAT | Announced short term spending on healthcare system, e.g. hospitals, masks, etc. Note: only record amount additional to previously announced spending |
| H5_INVESTMENT_IN_VACCINES | FLOAT | Announced public spending on Covid-19 vaccine development. Note: only record amount additional to previously announced spending |
| M1_WILDCARD | VARCHAR | Record policy announcements that do not fit anywhere else |
| STRINGENCY_INDEX | FLOAT | Calculated as a function of the individual indicators |
| STRINGENCY_INDEXFORDISPLAY | FLOAT | Calculated as a function of the individual indicators |
| STRINGENCY_LEGACY_INDEX | FLOAT | Calculated as a function of the individual indicators |
| STRINGENCY_LEGACY_INDEXFORDISPLAY | FLOAT | Calculated as a function of the individual indicators |
| GOVERNMENT_RESPONSE_INDEX | FLOAT | Calculated as a function of the individual indicators |
| GOVERNMENT_RESPONSE_INDEX_FOR_DISPLAY | FLOAT | Calculated as a function of the individual indicators |
| CONTAINMENT_HEALTH_INDEX | FLOAT | Calculated as a function of the individual indicators |
| CONTAINMENT_HEALTH_INDEX_FOR_DISPLAY | FLOAT | Calculated as a function of the individual indicators |
| ECONOMIC_SUPPORT_INDEX | FLOAT | Calculated as a function of the individual indicators |
| ECONOMIC_SUPPORT_INDEX_FOR_DISPLAY | FLOAT | Calculated as a function of the individual indicators |
| ACTIONS | JSONB | Raw response from Covid Tracker API Covid Tracker API containing all above indicators with full description stored in JSON format |
Schema for COUNTRY_STATISTICS table
| Name | Data type | Description |
|---|---|---|
| SOURCE | VARCHAR | Data source |
| YEAR | INT | Day of the statistics |
| GID | ARRAY | Unique geographical ID, for more details see GADM |
| COUNTRY | VARCHAR | English name for the country |
| COUNTRYCODE | VARCHAR(3) | ISO 3166-1 alpha-3 country codes |
| ADM_LEVEL | VARCHAR | Aggregation level, 0 for World Bank and Integrated Value Survey by country, 1 for Integrated Value Survey by region |
| SAMPLESIZE | VARCHAR | Number of questions for Integrated Value Survey, -1 for World Bank |
| PROPERTIES | VARCHAR | Dictionary containing the region/country statistics. For the full details on included variables consider the hyperlink above |
Data sources
There are currenlty six Tables in Oxford Covid-19 (OxCOVID19) Database with the sources listed below.
Disclaimer: Note that some geographical regions considered in this database are claimed by different countries. Some regions have undergone name changes since the last release of the GADM database. In our database we follow exactly the GID and names as given in GADM. This is merely to guarantee a standard way of relating data. In no case is this choice a manifestation of any political views by us or our universities.
Data sources for EPIDEMIOLOGY table
We have included or currently working on including the following sources:
| Country | Source code | Source | Features | Terms of Use |
|---|---|---|---|---|
| Australia | AUS_C1A | covid-19-au.com | tested, confirmed, recovered, dead, hospitalised, ICU | Strictly for educational and academic research purposes |
| Belgium | BEL_LE | Laurent Eschenauer | confirmed (country level data only), dead (country level data only), tested (country level data only), hospitalised (country level data only), hospitalised_icu (country level data only), recovered (country level data only) | CC0 1.0 Universal (CC0 1.0) Public Domain Dedication |
| Belgium | BEL_SCI | Epistat | ||
| Brazil | BRA_MSHM | Ministério da Saúde (Brasil) | confirmed (country level data only), dead (both country level and adm_area_1) | CC0 1.0 Universal |
| Canada | CAN_GOV | Government of Canada | tested, confirmed, recovered, dead | Attribution required, non-commercial use |
| Switzerland | CHE_OPGOV | Swiss Cantons and the Principality of Liechtenstein | CC 4.0 | |
| Mainland China | CHN_ICL | MRC Centre for Global Infectious Disease Analysis | confirmed (both country level and adm_area_1), dead (both country level and adm_area_1), recovered (both country level and adm_area_1) | CC BY NC ND 4.0 |
| Germany | DEU_JPGG | Jan-Philip Gehrcke | confirmed, dead | MIT |
| Spain | ESP_MS | Ministerio de Sanidad, Consumo y Bienestar Social | confirmed, dead, hospitalised, ICU | “Desnaturalización” prohibited, citation required |
| Spain | ESP_MSVP | Ministerio de Sanidad, Consumo y Bienestar Social | confirmed, recovered, dead, hospitalised, ICU | Apache License 2.0 |
| Austria | EU_ZH | Covid19-eu-zh | tested, confirmed, recovered, dead, hospitalised, hospitalised_icu | MIT |
| Czech republic | EU_ZH | Covid19-eu-zh | confirmed | MIT |
| Hungary | EU_ZH | Covid19-eu-zh | tested, confirmed, recovered, dead, quarantined | MIT |
| Ireland | EU_ZH | Covid19-eu-zh | MIT | |
| Germany | EU_ZH | Covid19-eu-zh | confirmed, dead | MIT |
| Norway | EU_ZH | Covid19-eu-zh | confirmed | MIT |
| Poland | EU_ZH | Covid19-eu-zh | confirmed, dead | MIT |
| Sweden | EU_ZH | Covid19-eu-zh | confirmed, dead, hospitalised_icu | MIT |
| Slovenia | EU_ZH | Covid19-eu-zh | tested, confirmed, dead, hospitalised, hospitalised_icu | MIT |
| France | FRA_SPF | Santé publique France | recovered, dead, hospitalised, ICU | License Ouverte/Open License 2.0 |
| France | FRA_SPFCG | Cédric Guadalupe | confirmed, recovered, dead | GPL 3.0 |
| UK – Northern Ireland | GBR_NIDH | Department of Health (Northern Ireland) | tested, confirmed, dead | |
| UK – England | GBR_PHE | Public Health England | confirmed | Open Government Licence v3.0 |
| UK – Scotland | GBR_PHS | Scottish Government | tested, confirmed | GPL 3.0 |
| UK – | GBR_PHTW | Tom White | tested, confirmed, dead | The Unlicense |
| UK – Wales | GBR_PHW | Public Health Wales | tested, confirmed | Open Government Licence v3.0 |
| Indonesia | IDN_GTPPC | Satuan Tugas Penanganan COVID-19 (Indonesia) | confirmed, recovered, dead | Standard “all rights reserved” notice. No licensing information. |
| India | IND_COVIND | COVID-19 India Org Data Operations Group | tested, confirmed, recovered, dead | GPL 3.0 |
| Ireland | IRL_HSPC | Health Protection Surveillance Centre | confirmed | No license specified’ – T&C state not for commercial use. T&C very focussed on OSI information, which is mapping information that we do not use |
| Italy | ITA_PC | Protezione Civile | tested, confirmed, recovered, dead, hospitalised, ICU, quarantined | CC BY 4.0 |
| Italy | ITA_PCDM | Protezione Civile | tested, confirmed, recovered, dead, hospitalised, ICU, quarantined | CC0 1.0 Universal |
| Japan | JPN_C1J | Shane Reustle | confirmed, recovered, dead, ICU | |
| Japan | JPN_C1JACD | COVID-19 Japan Anti-Coronavirus Dashboard | tested, confirmed, recovered, dead, hospitalised, ICU | CC BY |
| South Korea | KOR_DS4C | Jihoo Kim | tested, confirmed, recovered, dead | CC BY-NC-SA 4.0 |
| Argentina | LAT_DSRP | Data Science Research Peru | confirmed, dead | CC BY-NC-SA 4.0 |
| Brazil | LAT_DSRP | Data Science Research Peru | confirmed, dead | CC BY-NC-SA 4.0 |
| Chile | LAT_DSRP | Data Science Research Peru | confirmed, recovered, dead | CC BY-NC-SA 4.0 |
| Colombia | LAT_DSRP | Data Science Research Peru | confirmed, dead | CC BY-NC-SA 4.0 |
| Dominican Republic | LAT_DSRP | Data Science Research Peru | confirmed, recovered, dead | CC BY-NC-SA 4.0 |
| Ecuador | LAT_DSRP | Data Science Research Peru | confirmed, recovered, dead | CC BY-NC-SA 4.0 |
| Mexico | LAT_DSRP | Data Science Research Peru | confirmed, dead | CC BY-NC-SA 4.0 |
| Peru | LAT_DSRP | Data Science Research Peru | confirmed, recovered | CC BY-NC-SA 4.0 |
| Malaysia | MYS_MHYS | Young Shung | confirmed (country and adm_area_1), dead (country level only), hospitalised (country level only) | Public Domain Dedication and License v1.0 |
| Nigeria | NGA_CDC | Nigeria Centre for Disease Control | confirmed,recovered,dead | |
| Nigeria | NGA_SO | Nigeria Centre for Disease Control | confirmed, recovered, dead | No licensing information. |
| Netherlands | NLD_CW | Jonathan de Bruin | confirmed (both country and province level data), dead (country level data only), hospitalised (country level data only) | CC0 |
| Pakistan | PAK_GOV | National Information Technology Board, Government of Pakistan | confirmed, recovered, dead | |
| Poland | POL_WIKI | Wikipedia | confirmed, dead | CC BY-SA |
| Portugal | PRT_MSDS | Data Science for Social Good Portugal | confirmed (both country and admin_area_1), dead (both country and admin_area_1), recovered (country level data only), hospitalised (country level data only), hospitalised_icu (country level data only) | MIT |
| Russia | RUS_GOV | Government of Russia | confirmed, recovered, dead | |
| Sweden | SWE_GM | Elin Lütz | confirmed (for both country and adm_area_1), dead (for both country and adm_area_1) | MIT |
| Sweden | SWE_SIR | Svenska Intensivvårdsregistret | ICU | Public data may be used, but the source must be reported: Svenska Intensivvårdsregistret https://portal.icuregswe.org/siri/report/corona.inrapp (2020) |
| Thailand | THA_STAT | Open Government Data of Thailand | confirmed, recovered, dead, hospitalised | DGA Open Government License |
| Turkey | TUR_MHOE | Ministry of Health (Turkey) | “totalTests”, “totalCases”, “totalDeaths”,”totalIntensiveCare”, “totalIntubated”, “totalRecovered”, “tests”, “cases”, “deaths”, “recovered” | MIT |
| United States | USA_CTP | COVID Tracking Project | tested, confirmed, recovered, dead, hospitalised, ICU | CC BY-NC-4.0 |
| USA, county | USA_NYT | The New York Times | confirmed, dead | Attribution required, non-commercial use |
| World | WRD_ECDC | European Centre for Disease Prevention and Control | confirmed, recovered, dead | Attribution required |
| World | WRD_WHO | World Health Organization | confirmed, dead | |
| World | WRD_WHOJHU | Center for Systems Science and Engineering, Johns Hopkins University | confirmed, recovered, dead | CC BY 4.0 |
| South Africa | ZAF_DSFSI | Data Science for Social Impact Research Group, University of Pretoria | tested, confirmed (both country and adm_area_1), recovered , dead (both country and adm_area_1), hospitalised, hospitalised_icu, quarantined | MIT |
| Lebanon | LBN_GOV | Ministry of Information (Lebanon) | tested, confirmed, recovered, dead, hospitalised, ICU | |
| Saudi Arabia | SAU_GOV | Ministry of Health (Saudi Arabia) | confirmed, recovered, dead, tested | |
| Iraq | IRQ_GOV | World Health Organization | confirmed, recovered, dead |
Data sources for GOVERMENT_RESPONSE table
We have included or currently working on including the following sources:
| Source | Example Features | Terms of Use |
|---|---|---|
Oxford COVID-19 government response tracker |
SchoolClosing, WorkplaceClosing, CancelPublicEvents, ClosePublicTransport | CC BY 4.0 |
If you use GOVERNMENT_RESPONSE table please also cite:
Hale, Thomas, Sam Webster, Anna Petherick, Toby Phillips, and Beatriz Kira (2020). Oxford COVID-19 Government Response Tracker, Blavatnik School of Government.
Data sources for COUNTRY_STATISTICS table
We have included or currently working on including the following sources:
| Source | Terms of Use |
|---|---|
| World Bank | CC BY 4.0 |
| World Value Survey | with permission |
| European Value Study | with permission |
If you use COUNTRY_STATISTICS table please also cite:
Inglehart, R., C. Haerpfer, A. Moreno, C. Welzel, K. Kizilova, J. Diez-Medrano, M. Lagos, P. Norris, E. Ponarin & B. Puranen et al. (eds.). 2014. World Values Survey: Round Six – Country-Pooled Datafile Version: http://www.worldvaluessurvey.org/WVSDocumentationWV6.jsp. Madrid: JD Systems Institute.
Gedeshi, Ilir, Zulehner, Paul M., Rotman, David, Swyngedouw, Marc, Voyé, Liliane, Fotev, Georgy, Baloban, Josip,…(2016). European Values Study 2008: Integrated Dataset (EVS 2008). GESIS Datenarchiv, Köln. ZA4800 Datenfile Version 4.0.0, https://doi.org/10.4232/1.12458.
Data sources for MOBILITY table
We have included or currently working on including the following sources:
| Source | Source code | Features | Terms of Use |
|---|---|---|---|
| Google COVID-19 Community Mobility Reports | GOOGLE_MOBILITY | transit_stations, residential, workplace, parks, retail_recreation, grocery farmacy | Attribution required |
| Apple Mobility Trends Reports | APPLE_MOBILITY | driving, walking, transit | Attribution required |
Data sources for WEATHER table
We have included or currently working on including the following sources:
| Source | Example Features | Terms of Use |
|---|---|---|
| Met Office Informatics LAB | precip_max_avg, temperature_max_avg, windspeed_max_avg | Open Government Licence v3.0 |
Data sources for ADMINISTRATIVE_DIVISION table
We have included or currently working on including the following sources:
| Source | Example Features | Terms of Use |
|---|---|---|
| GADM | Polygons describing geographical area | GADM license |
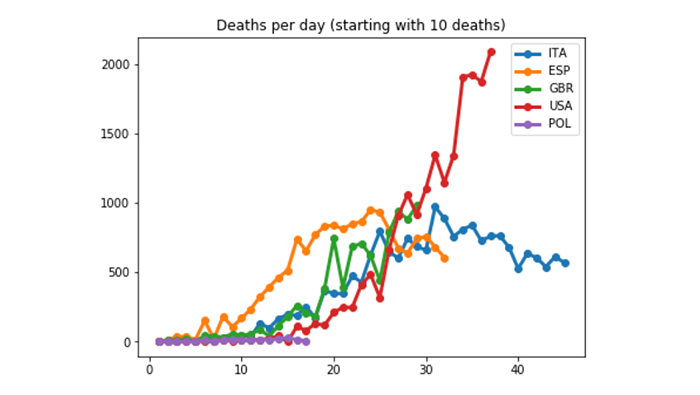
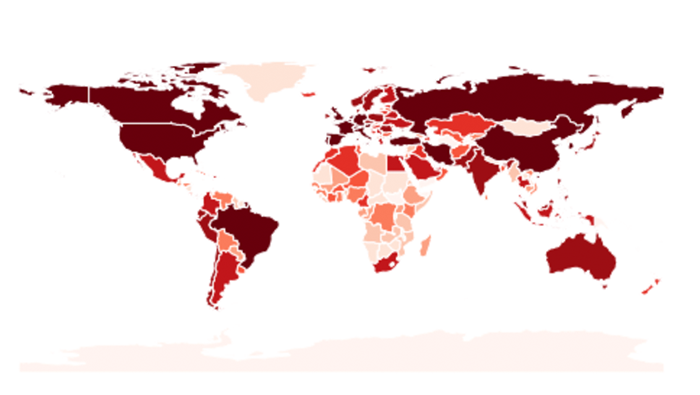
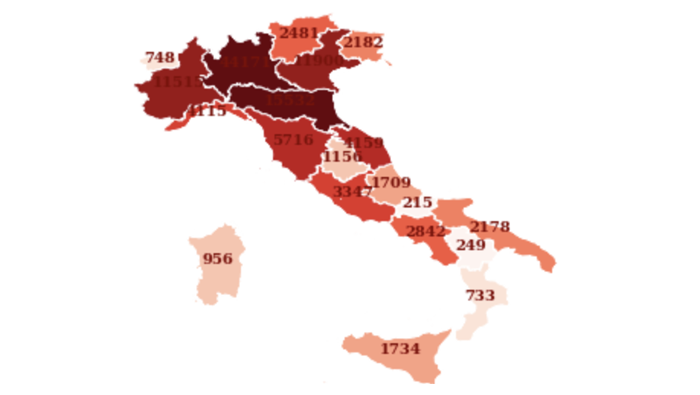
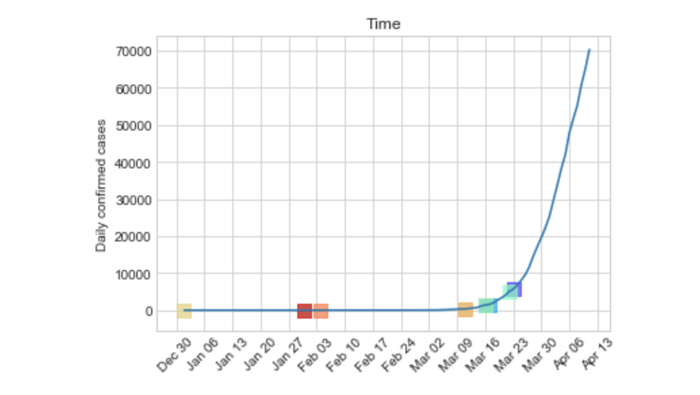
Examples of how to use the database
Examples of how to load and query OxCOVID19 Database and make simple visualisations in Jupyter notebook (Python). For more examples see our GitHub example repository. Feel free to get in touch if you would like to suggest or send us an informative visualisation usign OxCOVID19 Database.