
Adam Mahdi
DPhil Programme Director (SDS), Departmental Research Lecturer,
Oxford Internet Institute
Adam is the Project Lead.

When discussing the progression of the COVID-19 pandemic, the term “waves” is often heard. There are many different circumstances which can generate a wave in the time series of cases. We outline some possibilities in Table 1 (drawn from our recent paper[1]). These waves are not always driven simply by an increase in transmission. We present in this table three types of wave which were identified by comparing the time series of cases to that of deaths and of positivity ratios (the ratio of new cases per day to new tests per day).
The two main drivers of waves in cases are transmission and testing. A wave may be driven by an increase in transmission, an increase in testing, or some combination of these two factors. We can seek to infer the relative importance of the two factors after the fact, from the presence or absence of an accompanying mortality incidence peak. This relies on an assumption that the time series of deaths provides a more reliable and consistent indicator of trends in viral activity than the time series of cases. However, it is clear that the case fatality ratio changes over time, with vaccination being one key influence.
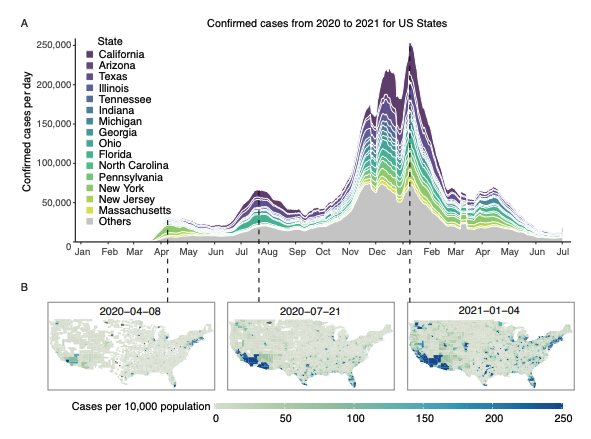
One can further identify a third type of wave at the national level (spatially asynchronous waves) where waves occur in different regions at different times, resulting in the appearance of multiple waves on the national scale. This figure illustrates a clear example in the United States, where we see three (perhaps four) waves of confirmed cases. There is an evident geographical variation between the waves, with the outbreak being concentrated in different regions at different times (Figure 1).
Table 1. Types of waves of confirmed cases observed during COVID-19 pandemic.
| Wave types | Description |
|---|---|
| Transmission waves | Waves of transmission in the population, which cannot be directly observed but may be inferred through the consequent demand for health care or active surveillance. The shape of these waves is a direct reflection of how the intensity of transmission changes over time and is best approximated by test positivity ratio curves (provided enough tests per day) and mortality data (in countries with close to no under-reporting of deaths). |
| Testing-enhanced waves | Waves of confirmed cases observed principally as a result of increased case ascertainment. Unlike transmission waves, those do not cause an increased demand on healthcare measured as the relative amounts of hospitalisation and mortality. A true wave of infections may underlie the test-enhanced wave but its scale cannot be determined without strong assumptions regarding unknown transmission dynamics. |
| Spatially asynchronous waves | Waves may occur in different geographical regions of a country at different times. When these are aggregated into a single time series it can result in the appearance of multiple waves at the aggregate level. This may be the result of a lag caused by geographical spread or of multiple index cases. |
Figure 1. A visualization of how the geographical concentration of COVID-19 has varied over time across the United States. Individual states show wave structures but the result of aggregating data at the national level is that local waves overlap and are not so distinct from each other.
1. Epidemiological waves – types, drivers and modulators in the COVID-19 pandemic. Harvey J, Chan B, Srivastava T, Zarebski AE, Dłotko P, Błaszczyk P, Parkinson RH, White LJ, Aguas R, Mahdi A. medRxiv. doi: https://doi.org/10.1101/2022.01.07.21268513